[1]:
import pyAMARES
Current pyAMARES version is 0.3.0
Author: Jia Xu, MR Research Facility, University of Iowa
Fitting MRS with unknown species, using HSVDinitializer
Try this tutorial on Google Colab!
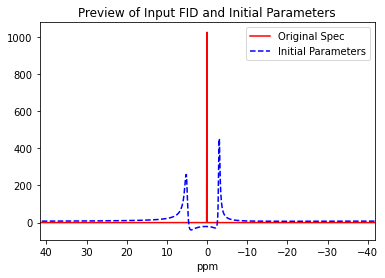
First, simulate a spectrum with two peaks
[2]:
priorknowledge = pyAMARES.initialize_FID(
    fid=None,
    priorknowledgefile="/home/xujia/gitlab/pyAMARES/docs/source/notebooks/attachment/singlet.csv",
    preview=True,
)
Warning, fid is None!
Checking comment lines in the prior knowledge file
Comment: in line 0 #  An example of singlet,,
Printing the Prior Knowledge File /home/xujia/gitlab/pyAMARES/docs/source/notebooks/attachment/singlet.csv
| Peak_A | Peak_B | |
|---|---|---|
| Index | ||
| Initial Values | NaN | NaN |
| amplitude | 10 | 8 |
| chemicalshift | 5 | -3 |
| linewidth | 100 | 50 |
| phase | 0 | 0 |
| g | 0 | 0 |
| Bounds | NaN | NaN |
| amplitude | (0, | (0, |
| chemicalshift | NaN | NaN |
| linewidth | (0, | (0, |
| phase | (-180, 180) | (-180, 180) |
| g | (0,1) | (0,1) |
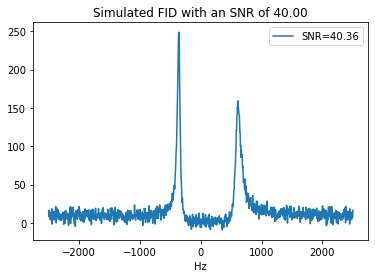
Simulate an MRS Spectra Using Scanner Parameters:
MHz (Field Strength): 300 MHz.
sw (Spectral Width): 5000.0 Hz.
Deadtime: 100 microseconds (100e-6 seconds).
Number of Points (fid_len): 1024
SNR (Signal to Noise Ratio, snr_target): 40.
[3]:
fid = pyAMARES.kernel.fid.simulate_fid(
    priorknowledge.initialParams,
    MHz=300.0,
    sw=5000.0,
    deadtime=100e-6,
    fid_len=1024,
    snr_target=40,
    preview=True,
)
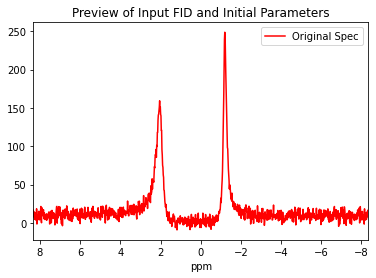
[4]:
FIDobj = pyAMARES.initialize_FID(
    fid=fid,
    MHz=300.0,
    sw=5000.0,
    deadtime=100e-6,
    priorknowledgefile=None,
    preview=True,
    normalize_fid=False,
)
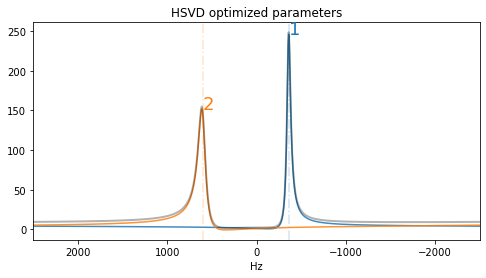
[5]:
params_hsvd = pyAMARES.HSVDinitializer(
    fid_parameters=FIDobj, num_of_component=2, fitting_parameters=None, preview=True
)
Norm of residual= 50.087
Norm of the data=1848.810
resNormSq / dataNormSq = 0.027
[6]:
params_hsvd
[6]:
| name | value | initial value | min | max | vary |
|---|---|---|---|---|---|
| ak_1 | 8.00411490 | 8.004114899421369 | -inf | inf | True |
| freq_1 | -359.992953 | -359.9929526890721 | -inf | inf | True |
| dk_1 | 159.839755 | 159.83975493389474 | 0.00000000 | inf | True |
| phi_1 | 1.0944e-04 | 0.00010944089342795904 | -3.14159265 | 3.14159265 | True |
| g_1 | 0.00000000 | 0.0 | -1.00000000 | 1.00000000 | False |
| ak_2 | 9.97848999 | 9.97848999424057 | -inf | inf | True |
| freq_2 | 600.082463 | 600.0824626203446 | -inf | inf | True |
| dk_2 | 316.144438 | 316.14443800037355 | 0.00000000 | inf | True |
| phi_2 | -0.00266153 | -0.0026615333065376457 | -3.14159265 | 3.14159265 | True |
| g_2 | 0.00000000 | 0.0 | -1.00000000 | 1.00000000 | False |
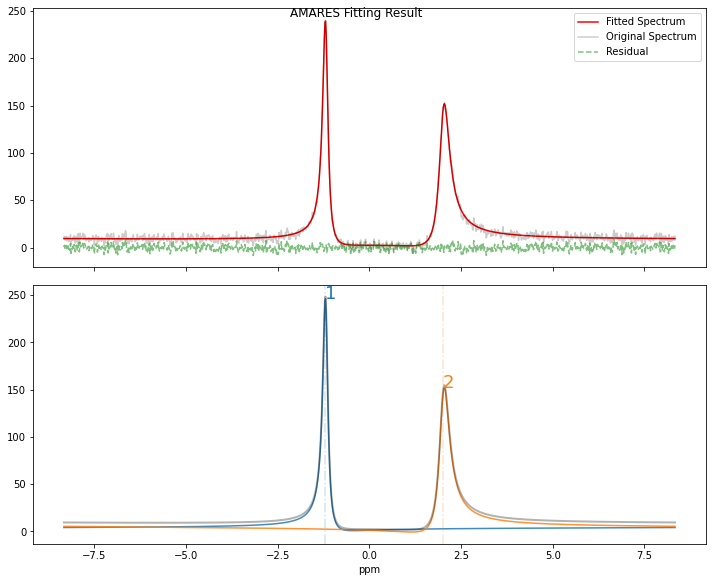
[7]:
FIDresult = pyAMARES.fitAMARES(
    fid_parameters=FIDobj,
    fitting_parameters=params_hsvd,
    method="least_squares",
    ifplot=True,
    inplace=False,
)
A copy of the input fid_parameters will be returned because inplace=False
Autogenerated tol is 4.080e-06
Fitting with method=least_squares took 0.025023 seconds
pm_index2=[]
No peaklist, probably it is from an HSVD initialized object
There is no result_sum generated, probably there is only 1 peak
Norm of residual= 50.086
Norm of the data=1848.810
resNormSq / dataNormSq = 0.027
plotParameters.xlim=None
xlim=None
/home/xujia/gitlab/pyAMARES/pyAMARES/util/crlb.py:171: RuntimeWarning: Warning: pm_index are all NaNs, return None so that P matrix is a identity matrix!
  warnings.warn("Warning: pm_index are all NaNs, return None so that P matrix is a identity matrix!" , RuntimeWarning)
[8]:
FIDresult.styled_df
[8]:
| amplitude | sd | CRLB(%) | chem shift(ppm) | sd(ppm) | CRLB(cs%) | LW(Hz) | sd(Hz) | CRLB(LW%) | phase(deg) | sd(deg) | CRLB(phase%) | g | g_sd | g (%) | |
|---|---|---|---|---|---|---|---|---|---|---|---|---|---|---|---|
| name | |||||||||||||||
| 1 | 8.005 | 0.057 | 1.234 | -1.200 | 0.001 | 0.100 | 50.885 | 0.507 | 221.901 | 0.023 | 0.406 | 2457.762 | 0.000 | 0.000 | inf |
| 2 | 9.974 | 0.080 | 1.395 | 2.000 | 0.002 | 0.133 | 100.553 | 1.131 | 498.422 | 359.876 | 0.459 | 524.732 | 0.000 | 0.000 | inf |
[9]:
FIDobj.ppm
[9]:
array([-8.33333333, -8.31704138, -8.30074943, ...,  8.30074943,
        8.31704138,  8.33333333])
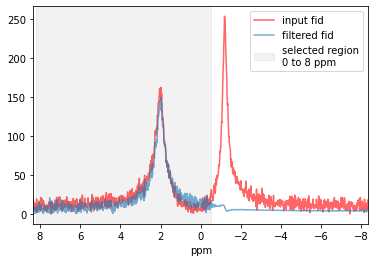
Frequency-Selective AMARES
Method 1: frequency-selective AMARES using MPFIR filter
References:
Vanhamme et al, J Mag Reson 143, 1-16(2000)
Sundin et al, J Mag Reson 139, 189-204 (1999)
[10]:
from pyAMARES import filter_param_by_ppm
[11]:
fit_ppm = (-0.5, 8.2) # ppm
[12]:
FIDobj2 = pyAMARES.filter_fid_by_ppm(FIDobj, fit_ppm=fit_ppm, ifplot=True)
[13]:
param2 = filter_param_by_ppm(params_hsvd, fit_ppm=fit_ppm, MHz=FIDobj2.MHz)
fit_Hz=[-150. 2460.]
Check if the expr for all parameters is restricted to a parameter that has already been filtered out.
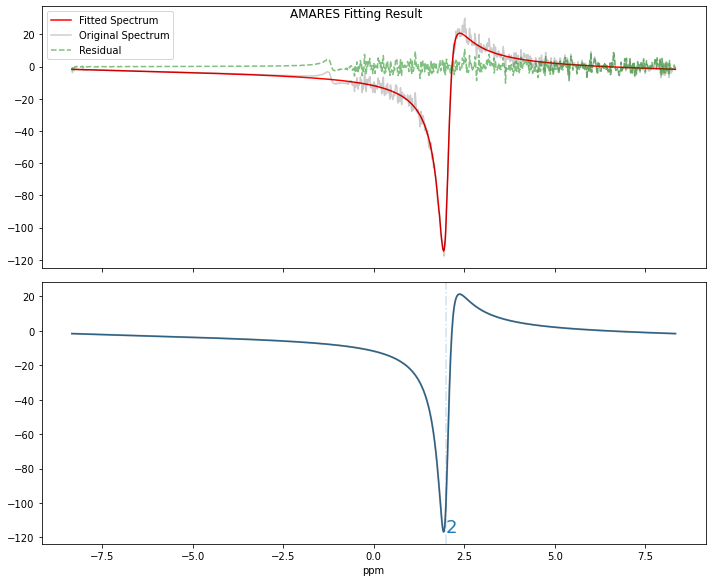
[18]:
FID_result_positive_ppm_peak = pyAMARES.fitAMARES(
    fid_parameters=FIDobj2,  # Filtered FID object
    fitting_parameters=param2,
    method="least_squares",
    ifplot=True,
    inplace=False,
)
A copy of the input fid_parameters will be returned because inplace=False
Autogenerated tol is 2.508e-06
Fitting with method=least_squares took 0.025438 seconds
pm_index2=[]
The amplitude of index [0]  is negative! Make it positive and flip the phase!
No peaklist, probably it is from an HSVD initialized object
There is no result_sum generated, probably there is only 1 peak
Norm of residual= 26.493
Norm of the data=668.985
resNormSq / dataNormSq = 0.040
plotParameters.xlim=None
xlim=None
/home/xujia/gitlab/pyAMARES/pyAMARES/util/crlb.py:171: RuntimeWarning: Warning: pm_index are all NaNs, return None so that P matrix is a identity matrix!
  warnings.warn("Warning: pm_index are all NaNs, return None so that P matrix is a identity matrix!" , RuntimeWarning)
[19]:
FID_result_positive_ppm_peak.styled_df
[19]:
| amplitude | sd | CRLB(%) | chem shift(ppm) | sd(ppm) | CRLB(cs%) | LW(Hz) | sd(Hz) | CRLB(LW%) | phase(deg) | sd(deg) | CRLB(phase%) | g | g_sd | g (%) | |
|---|---|---|---|---|---|---|---|---|---|---|---|---|---|---|---|
| name | |||||||||||||||
| 2 | 9.016 | 0.057 | 0.816 | 2.000 | 0.002 | 0.079 | 100.596 | 0.904 | 295.483 | 108.865 | 0.364 | 0.536 | 0.000 | 0.000 | inf |
Method 2: Frequency-Selective AMARES using Objective Function with frequency range
[22]:
??pyAMARES.objective_range # Check the `objective_function` in the Jupyter notebook cell
[20]:
FID_result_positive_ppm_peak2 = pyAMARES.fitAMARES(
    fid_parameters=FIDobj,
    fitting_parameters=param2,
    fit_range=fit_ppm,  # Instead of filtering out the spectrum,  (-.5, 8.2) ppm
    # is passed to the objective_func
    objective_func=pyAMARES.objective_range,  # This objective_range can accept the `fit_range` argument
    method="least_squares",
    ifplot=True,
    inplace=False,
)
A copy of the input fid_parameters will be returned because inplace=False
Autogenerated tol is 4.080e-06
Fitting range -0.4969045291625935 ppm to 8.202997719126751 ppm!
Fitting with method=least_squares took 0.014351 seconds
pm_index2=[]
No peaklist, probably it is from an HSVD initialized object
There is no result_sum generated, probably there is only 1 peak
Norm of residual= 1042.881
Norm of the data=1848.810
resNormSq / dataNormSq = 0.564
plotParameters.xlim=None
xlim=None
/home/xujia/gitlab/pyAMARES/pyAMARES/util/crlb.py:171: RuntimeWarning: Warning: pm_index are all NaNs, return None so that P matrix is a identity matrix!
  warnings.warn("Warning: pm_index are all NaNs, return None so that P matrix is a identity matrix!" , RuntimeWarning)
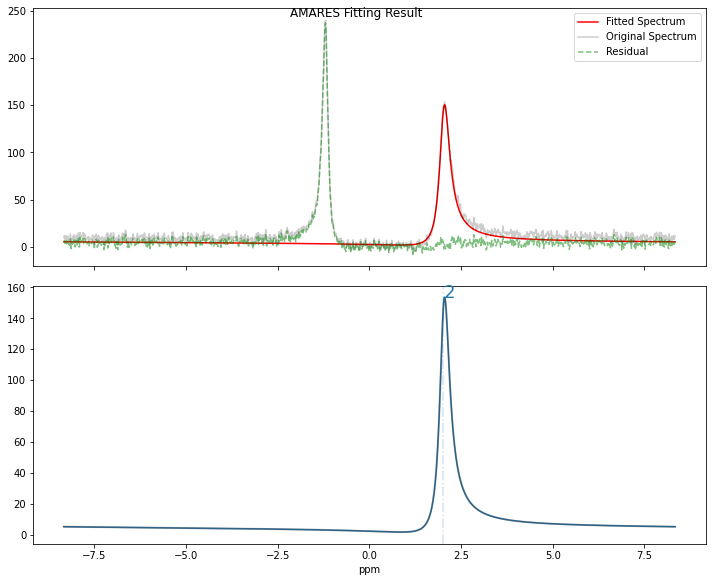
[21]:
FID_result_positive_ppm_peak2.styled_df
[21]:
| amplitude | sd | CRLB(%) | chem shift(ppm) | sd(ppm) | CRLB(cs%) | LW(Hz) | sd(Hz) | CRLB(LW%) | phase(deg) | sd(deg) | CRLB(phase%) | g | g_sd | g (%) | |
|---|---|---|---|---|---|---|---|---|---|---|---|---|---|---|---|
| name | |||||||||||||||
| 2 | 9.772 | 0.123 | 4.479 | 2.017 | 0.003 | 0.423 | 99.168 | 1.749 | 1598.949 | 354.157 | 0.723 | 35.806 | 0.000 | 0.000 | inf |
[ ]: